Product tour
Everything the robot does while you ship.
A small, focused tool: it audits your sites on a schedule, keeps the history, ranks them, and hands the results to anyone you want — including your AI assistant.
01 — Automated audits
Google's numbers, on a schedule
Every monitor is audited through the official PageSpeed Insights API — the same engine behind pagespeed.web.dev. Each audit runs 3 times and the median is stored, so a single noisy sample never moves your chart.
- A single Lighthouse test can vary by 10–15 points for the same page; taking the median of 3 runs reduces this to approximately 3 points.
- The 3 runs go out in parallel and the median is taken over whichever came back, so one failed run does not cost you the measurement. If all 3 fail, that cycle is skipped and the monitor is audited again at its next slot — the timestamp of the last successful measurement stays visible so you can see it happened.
- The dashboard shows daily averages, and every monitor keeps 30 days of score history.
- All sites are tested with desktop settings, which produces more stable and consistent scores.
Example audit
open the real oneTotal score = the average of all four
- Data source
- PageSpeed Insights API
- Cadence
- Every 24 hours
- Runs per audit
- Median of 3
- Strategy
- Desktop
- History
- 30 days
- Sites per account
- Up to 10
Score-drop alerts
Told before someone tells you
Turn on email notifications in Account Settings and pick your trigger: a total score drop of 5, 10 or 15 points. Alerts are opt-in — nothing is sent unless you ask for it.
Each email names the monitor, shows the old and the new score, and links straight to the details. A 24-hour cooldown per monitor keeps normal score fluctuation from turning into alert fatigue.
02 — Leaderboard
One board for the whole portfolio
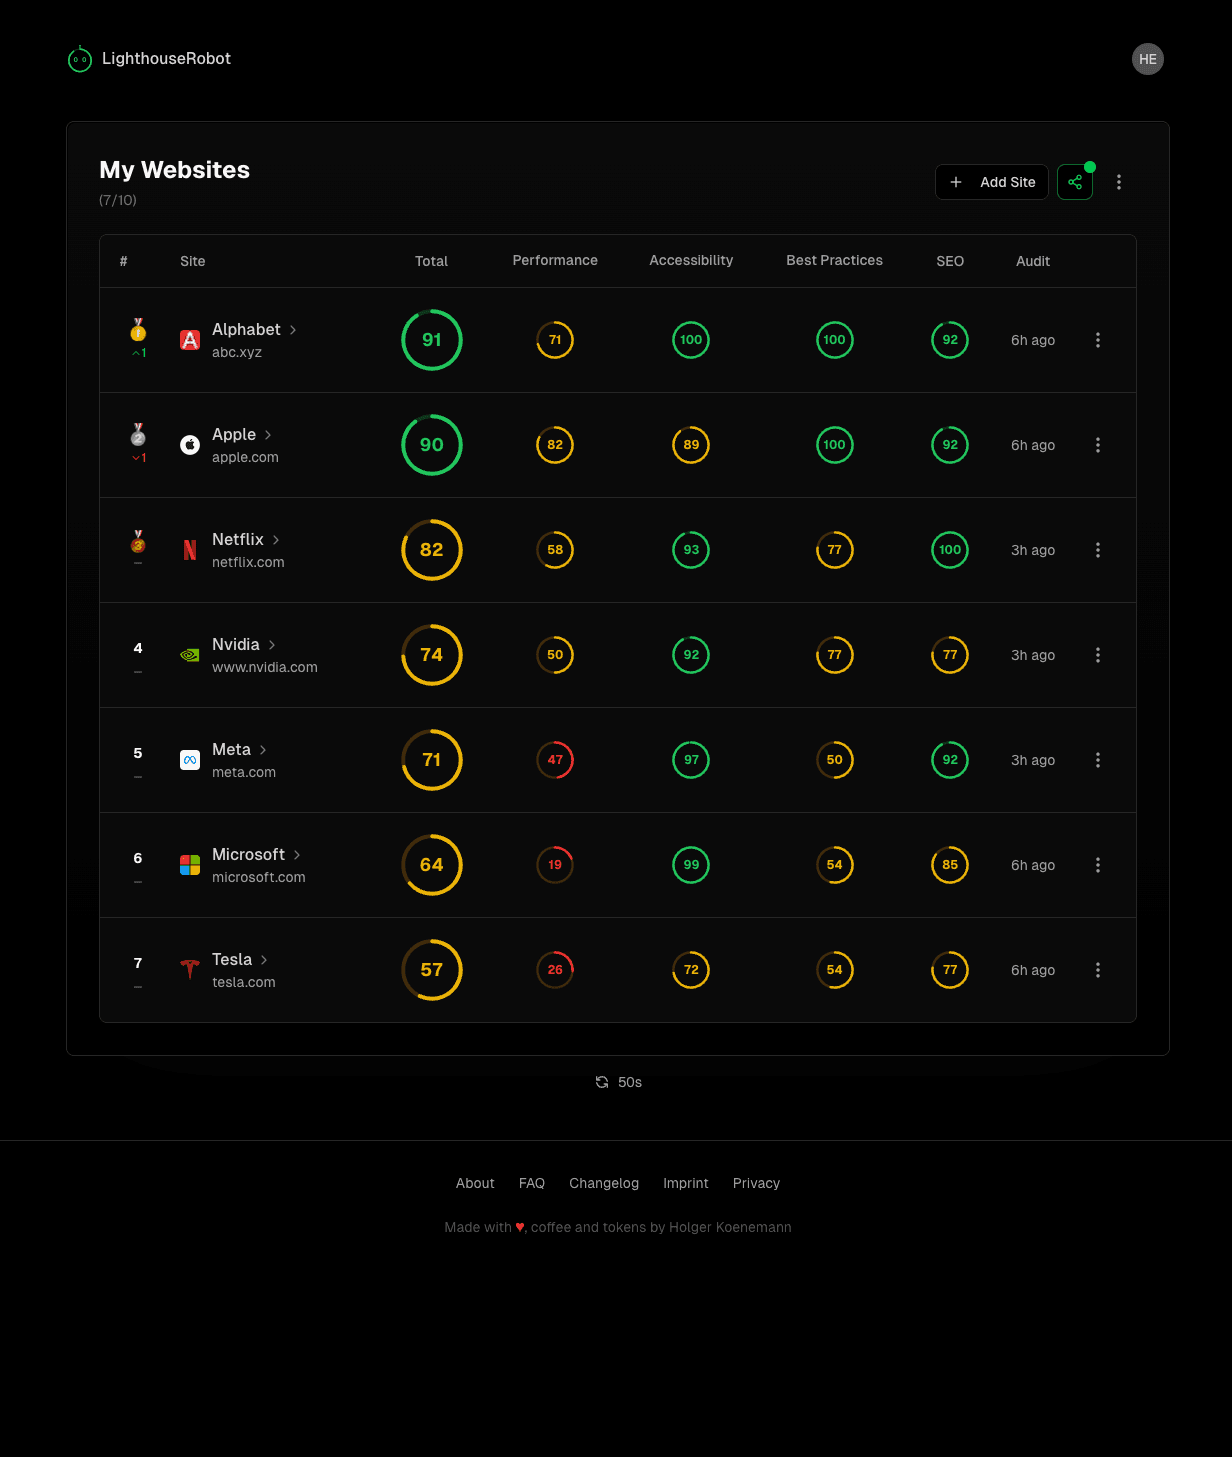
A leaderboard is a collection of the websites you want to compare, ranked automatically by Total Score — the average of Performance, Accessibility, Best Practices and SEO.
- Each account comes with 1 leaderboard and up to 10 monitored sites.
- Ranking movements show at a glance which websites improved and which declined.
- On a phone, rank, site and total score stay visible without scrolling; the category columns shorten to Perf, A11y and BP for a better fit.
03 — Monitor detail
The full picture behind one number
Open any monitor for its current daily average, a historical score chart, a Core Web Vitals breakdown with visual range bars, and an overview of what the page actually loads.
- Historical score chart showing trends over time
- Resource overview with total requests and page size
- Individual audit history, plus quick actions to run a new audit or share the monitor
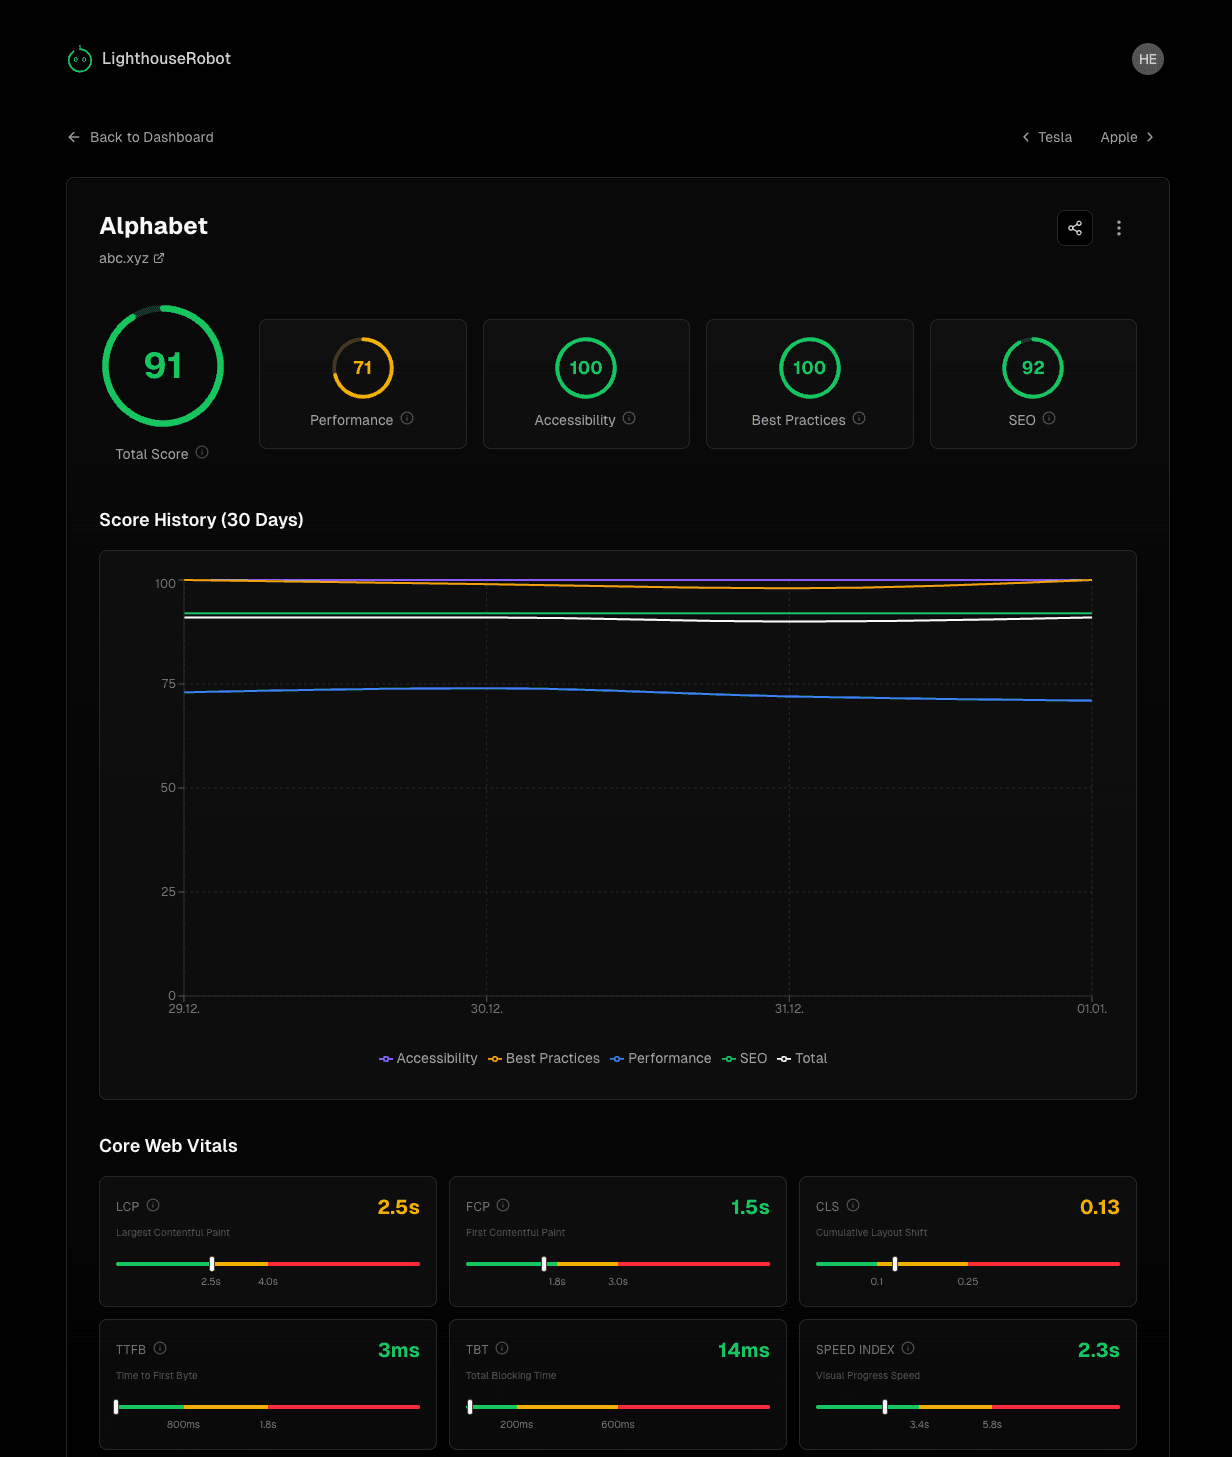
Core Web Vitals, with the good range marked
- LCPGood: under 2.5s
- Largest Contentful PaintHow fast the main content loads
- FCPGood: under 1.8s
- First Contentful PaintWhen the first content appears
- CLSGood: under 0.1
- Cumulative Layout ShiftVisual stability during loading
- TBTGood: under 200ms
- Total Blocking TimeHow long the page is unresponsive
04 — Sharing & badges
Hand the result to anyone
Everything is private by default. Sharing is opt-in per leaderboard and per monitor, and you can switch a link off again at any time — the three panels below are the live artifacts of this site's own monitor.
Public link
Sharing onAnyone with the link sees the board without an account on their side — good for clients, presentations and social posts. A pulsing green indicator on the monitor shows while sharing is active.
Embeddable badge
SVG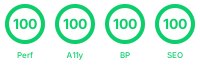
All four scores as rings, in the official Lighthouse colors. Copy the HTML from the Share modal into a README or a footer — it updates itself and links back to your public share page. Prefer to draw your own? Swap .svg for .json and the same numbers arrive as data, readable from any site.
Social card
1200×630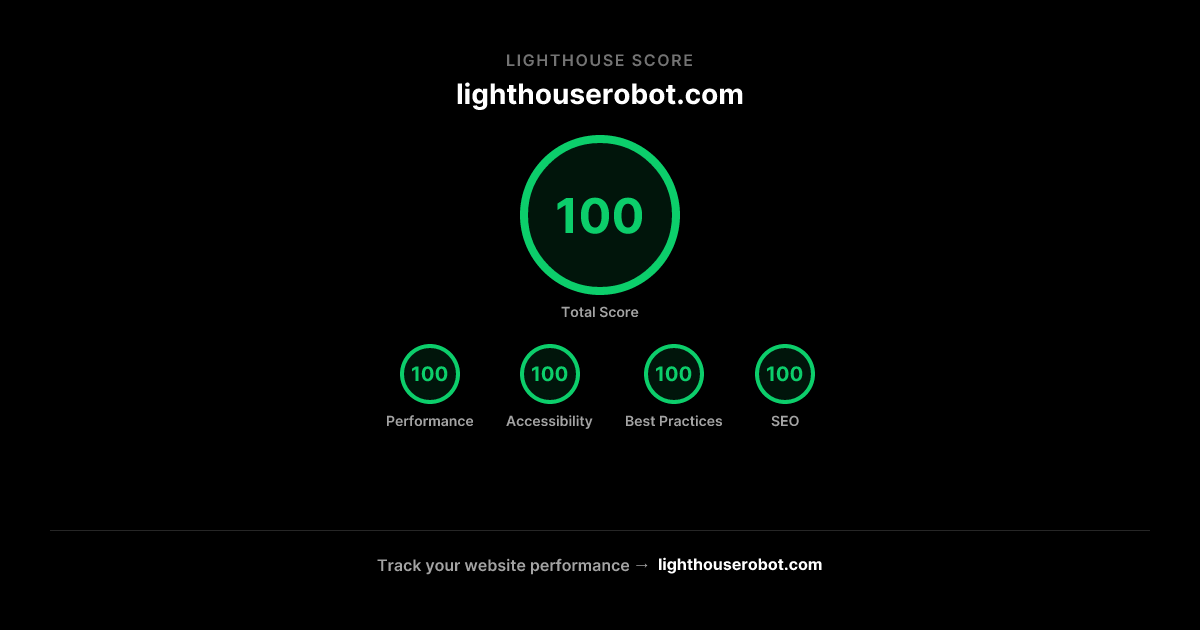
Every share link renders this card on LinkedIn, X, Slack and anywhere else that reads Open Graph — the score ring plus all four categories, generated per link.
05 — MCP & API
Ask your assistant what to fix
LighthouseRobot ships an MCP server, so any MCP-compatible client can read your performance data and answer questions about it. Two clients are documented end to end; the same token works for programmatic access.
Claude Desktop
stdio{ "mcpServers": { "lighthouserobot": { "command": "npx", "args": [ "-y", "mcp-remote", "https://lighthouserobot.com/api/mcp", "--header", "Authorization: Bearer YOUR_API_TOKEN" ] } }}Open Settings → Developer → Edit Config and Claude Desktop opens the file for you, or edit it directly at ~/Library/Application Support/Claude/ on macOS, %APPDATA%\Claude\ on Windows. Quit the app completely and reopen it afterwards.
Cursor
http{ "mcpServers": { "lighthouserobot": { "url": "https://lighthouserobot.com/api/mcp", "headers": { "Authorization": "Bearer YOUR_API_TOKEN" } } }}Cursor speaks to the endpoint directly, so there is no mcp-remote bridge to install. Drop the file in the project folder and restart Cursor.
Generate
Account Settings → API Tokens → Generate New Token, named per device.
Copy once
The plain token is shown a single time and never again.
Stored hashed
Only a SHA-256 hash reaches the database, so a leak of it cannot be replayed.
Revoke
Kill any token from Account Settings without touching the others.
Ask this — answered by
8 tools“Which dashboards do I have?”
list_dashboards
“Show me my dashboard overview”
get_dashboard
“List all my monitored websites”
list_monitors
“How is example.com performing?”
get_monitor
“What should I optimize on example.com?”
get_improvement_suggestions
“Generate a performance report for the last 7 days”
get_performance_report
“Show me the ranking history for my site”
get_ranking_history
“Which websites improved or declined this week?”
get_winners_losers
That's the whole tour.
Every screen above is live today, free, and yours in about a minute. Up to 10 sites, audited every 24 hours.